
Dashboards everyone finally agrees with.
Metabase, Looker, or custom dashboards built on a real metrics layer — dbt plus Cube or Lightdash — where every number has one owned, version-controlled definition. So revenue means the same thing in the board deck, the sales review, and the spreadsheet, and leadership stops asking which version is the real one.
Two dashboards, two numbers, one wasted meeting.
You've sat in the review where the sales board says one revenue figure and the finance deck says another, and the next twenty minutes go to arguing about whose number is right instead of what to do about it. The cause isn't a bad chart — it's that each dashboard quietly invented its own definition. We fix it underneath: a metrics layer where every metric is defined once, owned by a person, and kept in version control, so each dashboard reads the same calculation. Leadership stops second-guessing the numbers because there's only one of each.
Nobody trusts the dashboard anymore.
Every symptom traces back to the same gap — metrics defined in too many places.
- 01
Two dashboards show different numbers for the same metric
One metrics layer every dashboard reads from — the figures reconcile by design.
- 02
Definitions live in someone's head, not anywhere you can read
Owned, written-down metric definitions in version control.
- 03
Leadership keeps asking for the 'real' version of a number
One definition per metric, so there's no other version to ask for.
- 04
A metric quietly broke and nobody noticed for a week
Drift alerting that flags the move before the leadership meeting.
- 05
Everyone can see numbers they shouldn't
A permission model — the right people see the right metrics.
A metrics layer, then the dashboards on top.
Not a prettier chart — the layer underneath that makes every chart agree.

Metrics layer
dbt plus Cube or Lightdash — definitions declared once, queried everywhere.

Owned definitions
Every metric written down, named to an owner, kept in version control.

Dashboards
Metabase, Looker, or custom — chosen for your team, fed by one source.

Permission model
The right people see the right numbers; sensitive ones stay restricted.

Drift alerting
A metric that jumps, drops, or flatlines raises a flag before the meeting.

Quarterly review
A standing cadence to catch slow drift before it forks the numbers again.
From source to definition to a dashboard you trust.
- Sources01
- Metrics layer02
- Definitions03
- Dashboard04
- Drill-down05
- Alerts06
A metric is defined once in the middle, so the dashboard and the drill-down always reconcile, and any unexpected move trips an alert. That's the difference between hoping the dashboards agree and knowing they have to.
Define each metric once, use it everywhere.
We model your clean tables in dbt, then declare the metrics on top in Cube or Lightdash. Revenue, churn, active users — each one becomes a single, queryable definition every tool reads from, instead of logic re-invented inside every dashboard.
- dbt models, tested and version-controlled
- Metrics declared in Cube or Lightdash
- One calculation, queried from any tool
- Change it once, every dashboard updates


The definition stops living in someone's head.
Every metric gets written down, named to an owner, and kept in version control. When someone changes how churn is calculated, it's a reviewed, dated commit — not a silent tweak in a saved query that nobody else can see or reproduce.
- Each metric written down and explained
- An owner on the record for every one
- Changes are reviewed, dated commits
- No more 'ask the analyst what this means'
The right dashboard, fed by the same source.
Metabase for fast self-serve, Looker where you want heavy governance, or a custom build when the view is core to your product. Whichever we choose, it reads from the metrics layer — so the headline reconciles with the drill-down, every level down to the rows.
- Metabase, Looker, or custom — chosen for fit
- Drill from company total to the actual rows
- Every level reconciles to the headline
- Self-serve, without pinging the data team

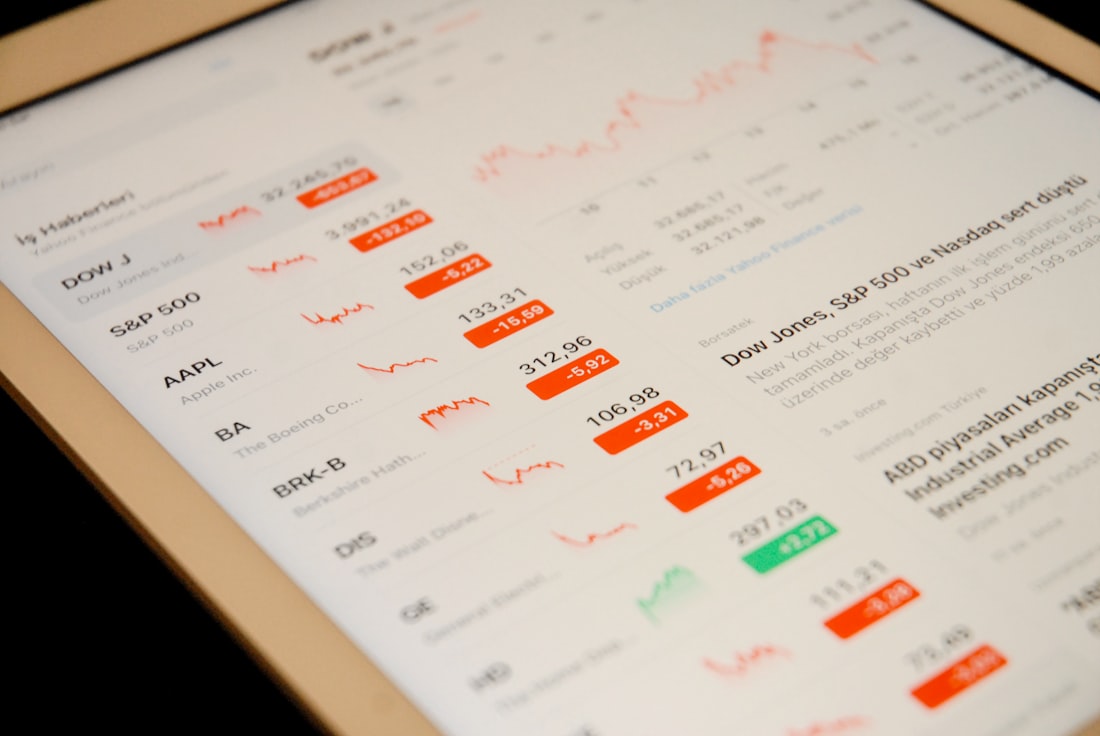
It flags drift before the meeting does.
Key metrics are watched for moves that usually mean something broke — a signup count crashing to zero, revenue doubling because a source double-loaded. And a permission model keeps the right numbers in front of the right people, with the sensitive ones restricted.
- Drift alerts to the right channel
- Caught before it hits a leadership deck
- Permissions by team, region, and role
- Sensitive metrics kept locked down

Built to be trusted — and kept that way.
Agree the metrics
We sit with the people who argue about the numbers and pin down what each metric actually means.
Build the metrics layer
Clean tables in dbt, then the agreed definitions declared in Cube or Lightdash as one source.
Build the dashboards
Metabase, Looker, or custom — with drill-down, all reading from the same metrics layer.
Add permissions & alerting
A permission model for who sees what, and drift alerts that catch a metric breaking quietly.
Set the review cadence
Documentation, a handover, and a quarterly review so the definitions don't drift apart again.
The numbers have stopped settling arguments.
Different dashboards, different numbers
When the sales board and the finance deck disagree, the review becomes an argument about the data instead of the business.
Definitions live in one person's head
If only the analyst knows what 'active user' means, the company is one resignation away from not knowing its own metrics.
Leadership wants the 'real' version
When people ask for the real number, it's a sign there are several — and none of them is fully trusted.


Proven BI tools, used with discipline.
The things leadership asks first.

Give every metric one definition.
Tell us which numbers your leadership argues about and where they come from. We'll build the metrics layer and the dashboards on top — owned definitions, permissions, drift alerting, and a review cadence — so the next meeting is about the business, not whose figure is right.