
Data your dashboards can actually trust.
Production ELT from your databases, APIs, and SaaS tools into BigQuery, Snowflake, or Postgres — modelled in dbt, tested automatically, and traced with column-level lineage. So when a number looks wrong, you can follow it straight back to where it came from.
When a number looks wrong, nobody can say where it came from.
That's the moment trust in data dies — a figure on a dashboard that finance disputes, and no one able to trace it back. The fix isn't a prettier chart; it's the plumbing underneath. We build pipelines that pull from your real sources into a warehouse, transform the data in tested, version-controlled models, and keep column-level lineage from source to dashboard. The result is data your team stops second-guessing — because every number has a paper trail.
You've stopped trusting the numbers.
Each symptom has the same root — and the same fix underneath.
- 01
Analytics live in a CSV someone refreshes by hand
A scheduled pipeline — current every morning, untouched by humans.
- 02
A number is disputed and can't be traced
Column-level lineage from the dashboard back to source rows.
- 03
Pipeline failures are silent
Freshness and volume checks that alert before a report goes stale.
- 04
Nobody knows which dashboards depend on which tables
A dependency map, so changes are deliberate, not a gamble.
- 05
Transformations are SQL only one person understands
Tested, documented dbt models the whole team can read.
The plumbing behind a number you can trust.
From raw source to a tested model — the unglamorous work that makes analytics reliable.

Source connectors
Fivetran, Airbyte, or custom extractors — CDC where it matters.

dbt models
Version-controlled transformations the whole team can read.

Automated tests
No duplicate keys, no stray nulls, values in the ranges they should be.
Column-level lineage
Every figure traceable from dashboard back to source row.
Cost & freshness monitoring
Alerts when data is late, light, or quietly expensive.

Documentation
A warehouse your team can maintain without us in the room.
Every number, traceable to its source.
- Sources01
- Ingest02
- Warehouse03
- dbt models04
- Tested05
- Dashboards06
A change at any step shows its blast radius downstream, and any figure on the right traces back to the rows on the left. That's the difference between hoping the data is right and knowing it.
Pull from everything, reliably.
Managed connectors for the common SaaS tools and databases, custom extractors for the APIs that don't have one, and change-data-capture where the warehouse needs to stay close to real time. Ingestion you set up once and stop thinking about.
- Fivetran / Airbyte for the common sources
- Custom extractors for internal & partner APIs
- Change-data-capture for near-real-time
- Retries and backfills handled

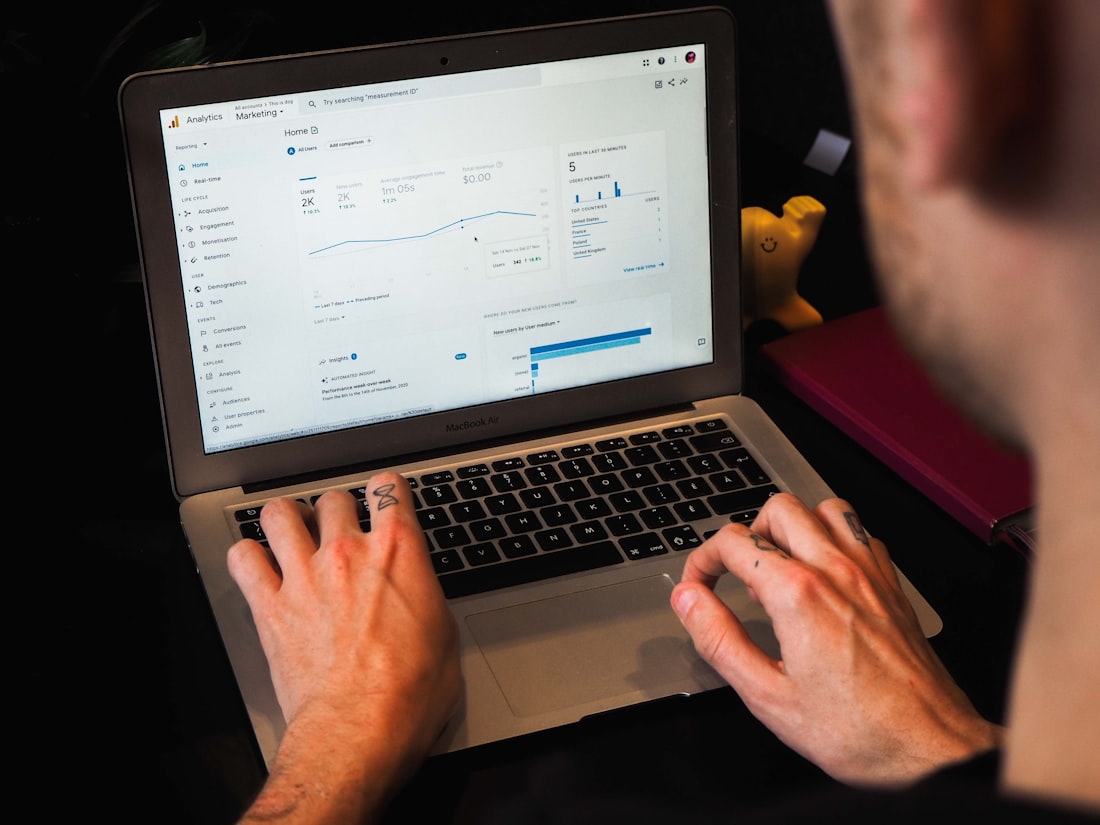
Transformations you can actually trust.
Raw data becomes clean, documented dbt models with automated tests on the things that matter. Instead of a pile of SQL only one person understands, you get a tested transformation layer the whole team can change safely.
- Version-controlled dbt models
- Tests for keys, nulls, and ranges
- Readable, documented SQL
- Safe to change six months later
Follow any figure to its source.
Column-level lineage maps every number from the dashboard back through the models to the source rows. Disputes get resolved by following the trail, and schema changes get made with the downstream impact known in advance.
- Dashboard-to-source traceability
- Known blast radius before a change
- Faster debugging when data breaks
- Confidence in the numbers you ship


It tells you before the report goes stale.
Freshness, volume, and cost are watched continuously. A pipeline that stops, slows, or returns suspiciously little raises an alert to the right channel — and the expensive queries get flagged and tuned before the bill surprises anyone.
- Freshness & volume alerting
- Cost tracked per model and query
- Tuned partitioning & incremental builds
- Problems found by us, not stakeholders
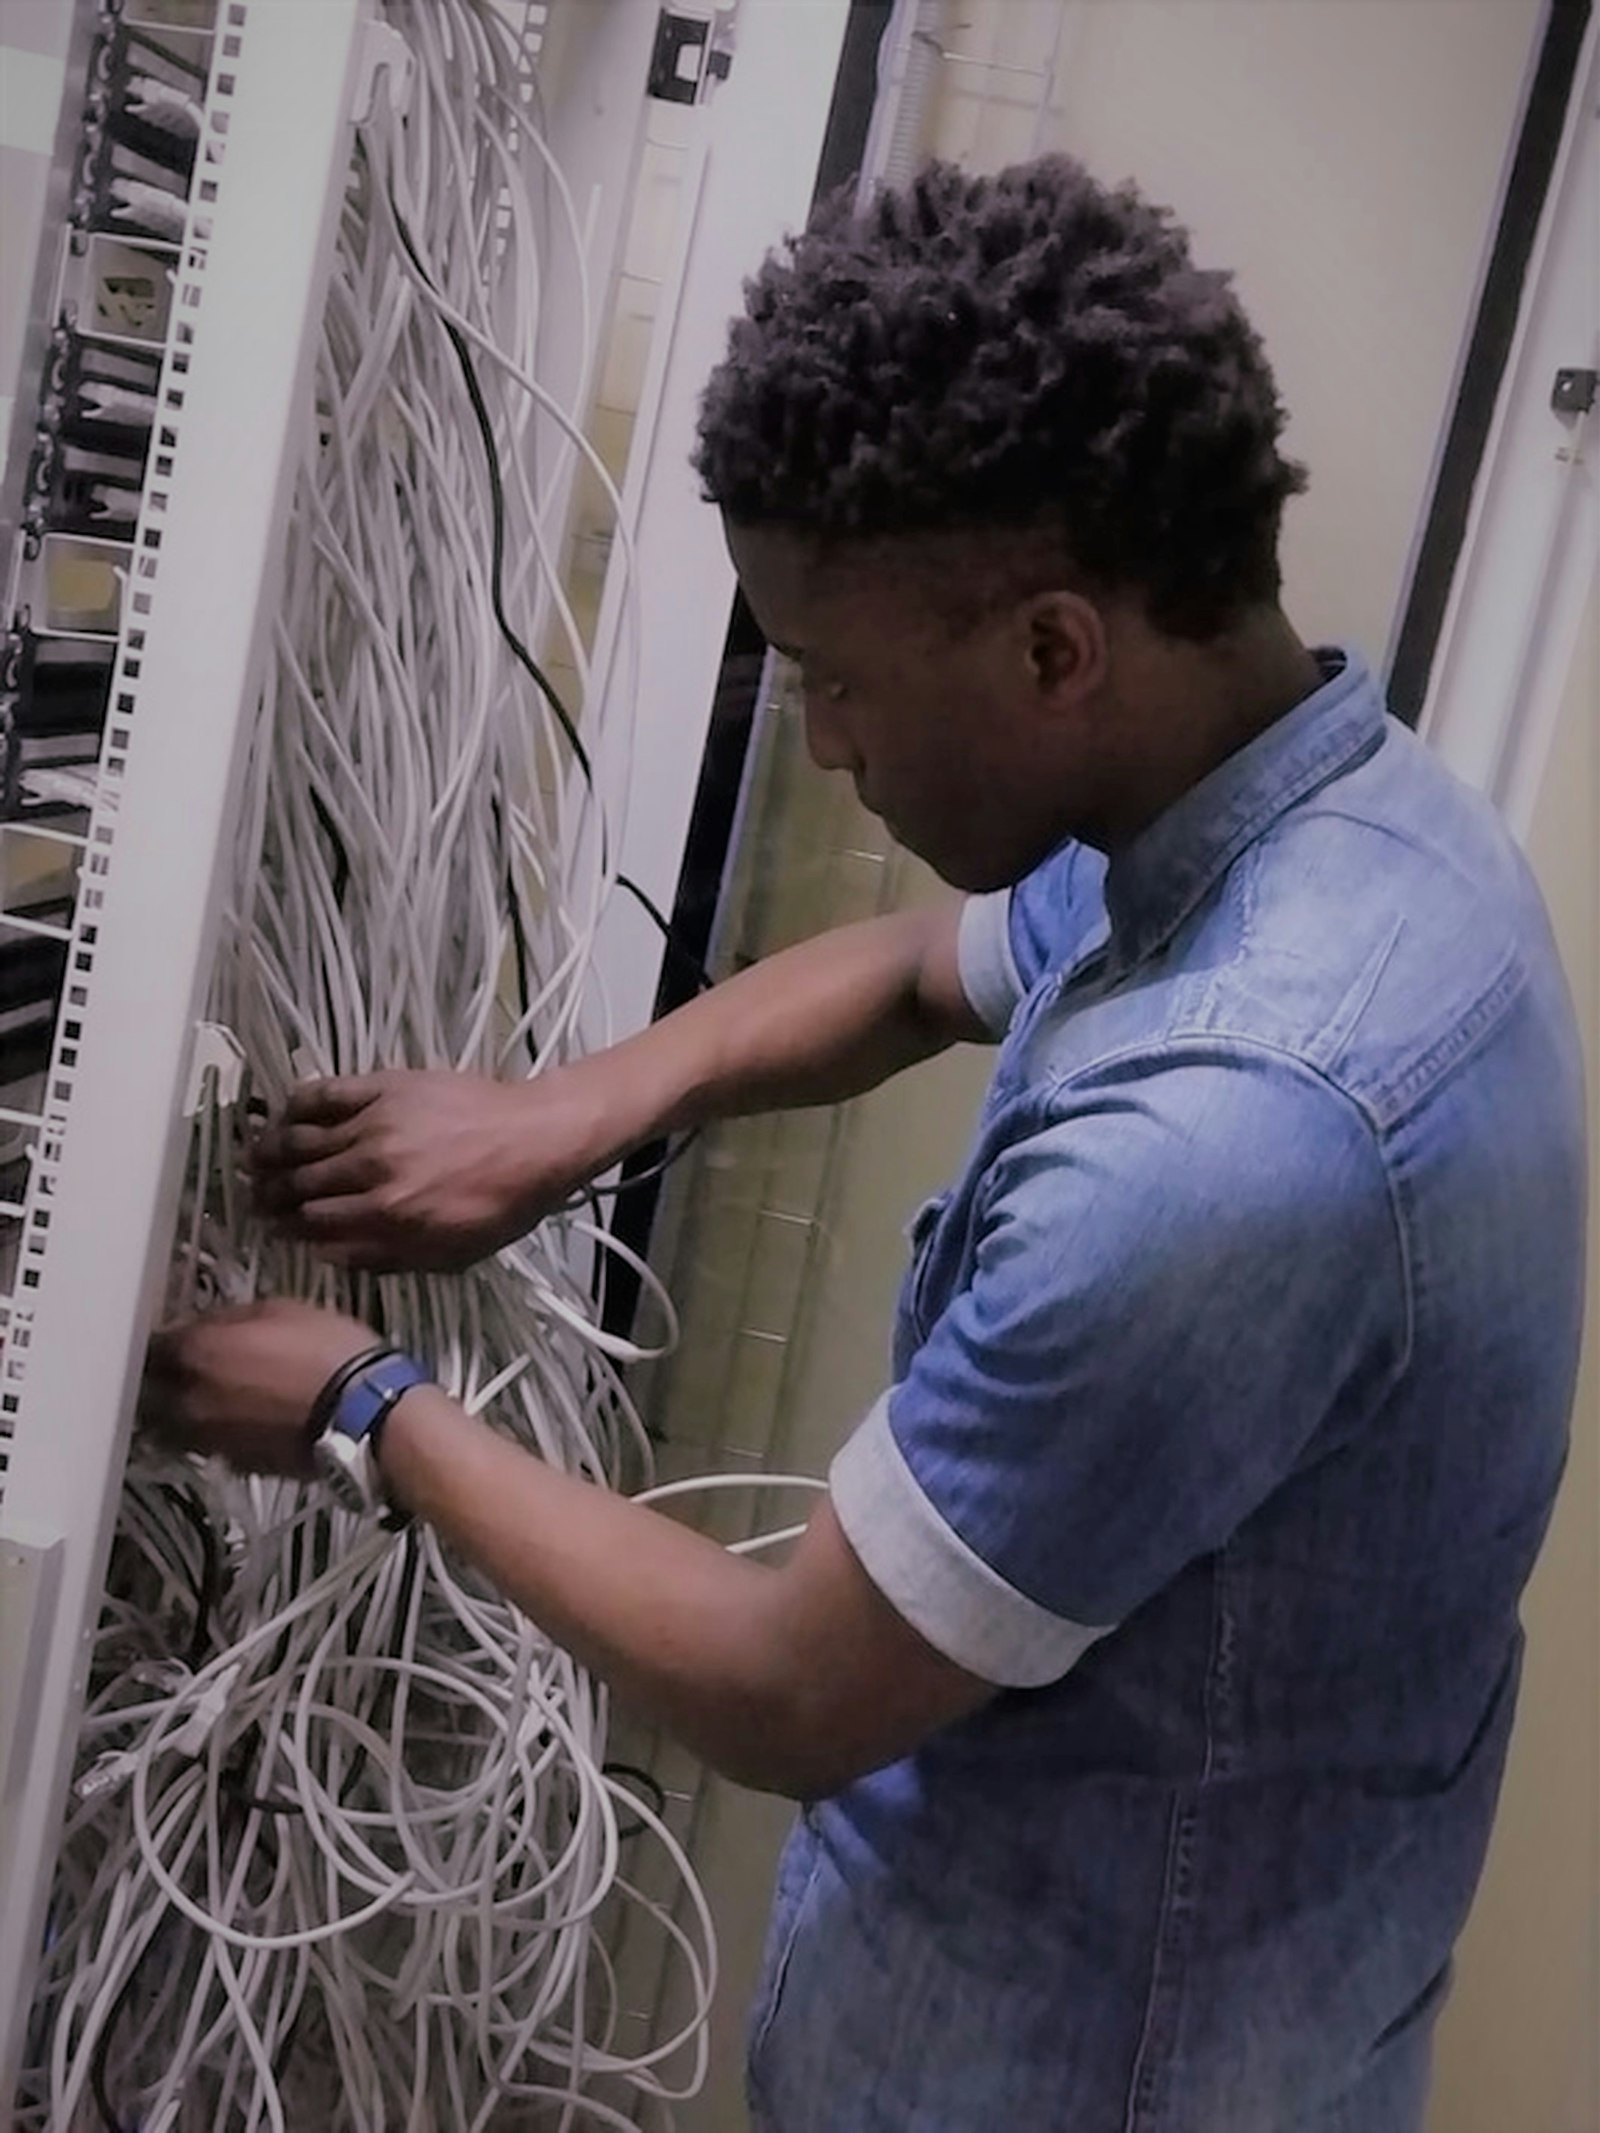
Built to be trusted — and maintained.
Audit the sources
We catalogue where your data lives, how it changes, and which numbers people actually rely on.
Design the model
We design the warehouse layout and the dbt model structure before building, so it scales sensibly.
Build connectors & models
Ingestion, transformations, and tests — assembled into a pipeline that runs on a schedule.
Add lineage & monitoring
Column-level lineage, freshness and cost alerting, and the checks that catch silent failure.
Document & hand over
Docs, a walkthrough, and a system your team can maintain and extend on their own.
The spreadsheet has become the system.
Analytics live in a manual CSV
Flexible until the person who refreshes it is busy — then the whole company is flying blind.
Failures are silent
A pipeline that breaks quietly is worse than one that breaks loudly; you find out from the wrong person.
No one trusts the dashboard
When numbers can't be traced, every review turns into an argument about the data instead of the business.


Proven data tools, used with discipline.
The things data teams ask first.

Give your numbers a paper trail.
Tell us where your data lives and which numbers people argue about. We'll build the pipeline that brings it into a warehouse — modelled, tested, and traceable — so the dashboard becomes the end of the argument, not the start of one.