
Reports that write themselves.
Stop exporting spreadsheets and rebuilding the same deck every month. This demo connects to your data, answers plain-English questions with live charts, builds the dashboards once, and delivers the right report to the right person — on schedule, every time, with numbers you can trace back to the source.
By the time a hand-built report is finished, the numbers are already stale.
Most teams make reports by hand. Someone exports a few CSVs, wrestles them into a spreadsheet, copies charts into a slide deck, and sends it round — every week, every month, every board meeting. It eats a day, it's easy to get subtly wrong, and the moment it's sent it starts going out of date. This demo shows the grown-up version: connect the data once, let anyone ask for what they need in plain English, build the dashboards a single time, and let the system deliver fresh, accurate reports on a schedule — so reporting stops being a chore and starts being something you trust.
Four jobs, one system.
- 01
Connect every source
Databases, warehouses, spreadsheets, and the SaaS tools you already use — joined into one live, consistent model of your numbers.
- 02
Ask in plain English
“Revenue by region last quarter” returns a chart and the underlying figures in seconds — no SQL, no waiting on the data team.
- 03
Build dashboards once
Pin the answers that matter into living dashboards that stay current on their own — no manual refresh, no copy-paste.
- 04
Schedule & deliver
The right report lands in the right inbox, Slack channel, or PDF — daily, weekly, or after month-end close, automatically.

From a question to a report in its inbox.
- 1ConnectYour real sources
- 2AskIn plain English
- 3BuildCharts & dashboards
- 4ScheduleSet the cadence
- 5DeliverFresh, on time
Someone asks for a number in plain language; the system writes the query against your real data, returns a chart and the figures, and shows exactly how it got there. Pin it to a dashboard, set a cadence, and it delivers itself from then on — no exports, no manual refresh, and a clear trail from every chart back to its source.
Every number, always current.
Live dashboards and scheduled reports — built once, never stale.
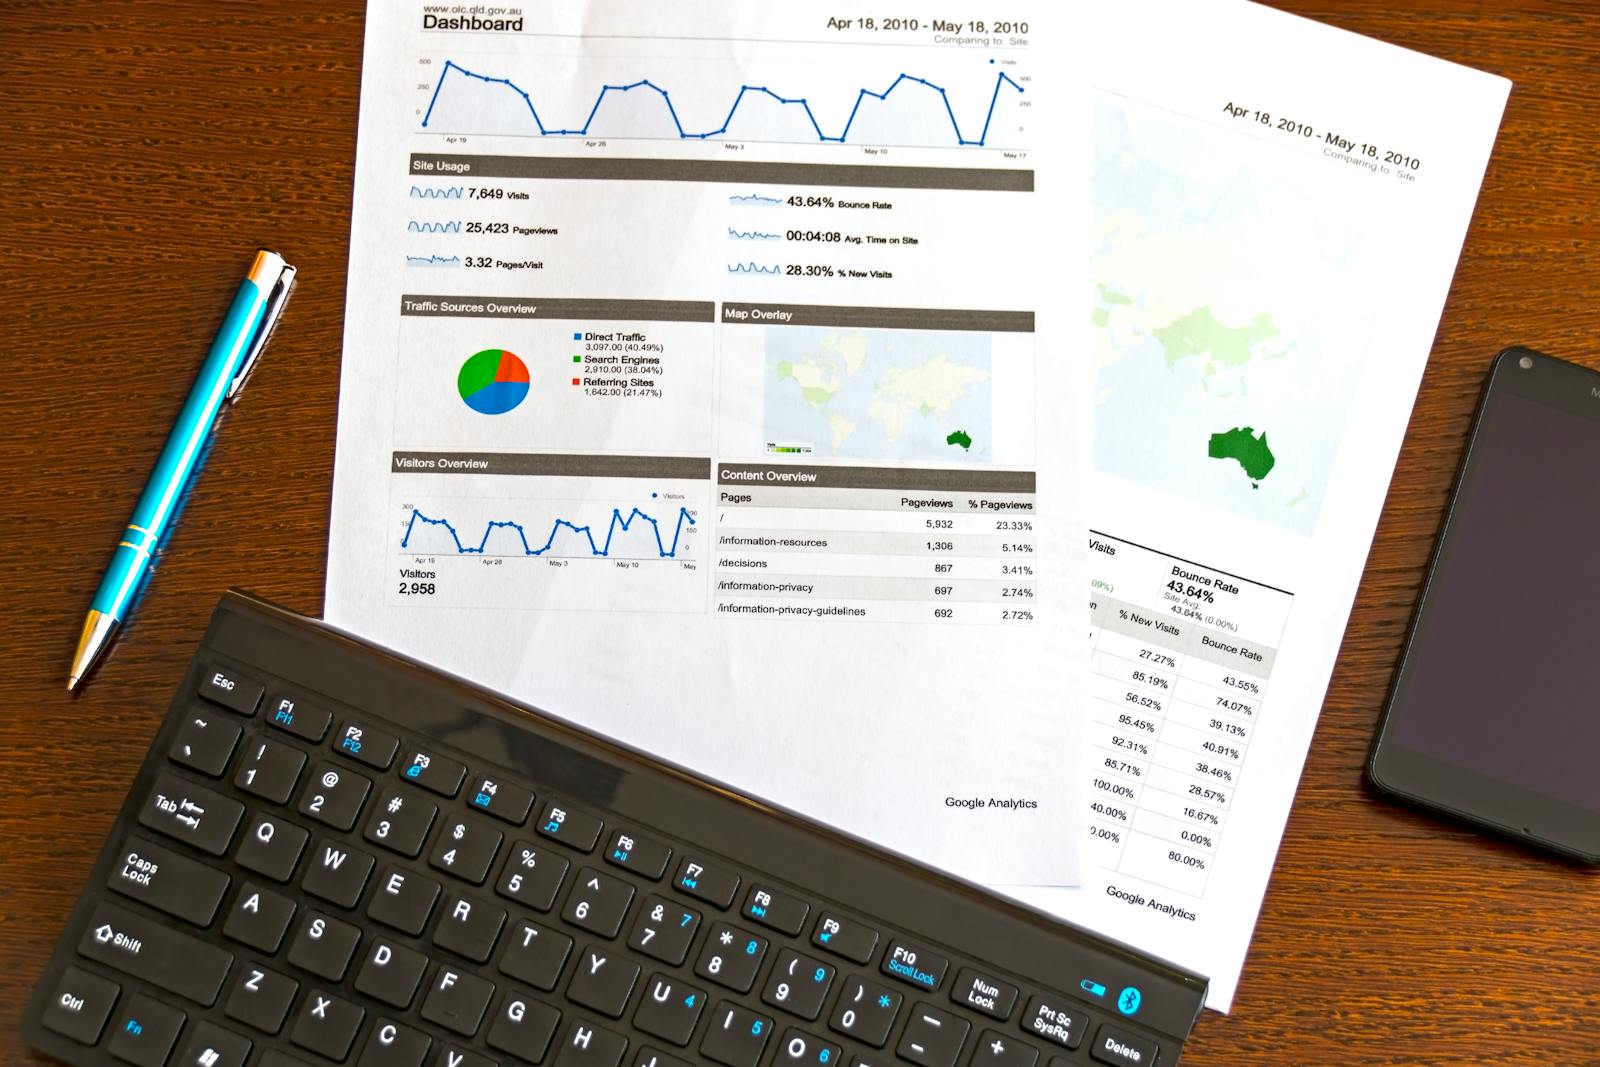
One place for every number.
The system reads your real data — databases, warehouses, spreadsheets, and SaaS tools — with least-privilege, read-only access, and joins it into one consistent model. Definitions are pinned once, so “revenue” means the same thing on every report, and nobody rebuilds a number from scratch in a spreadsheet again.
- Databases, warehouses, spreadsheets, and SaaS APIs
- Read-only by default — your data stays where it lives
- One shared definition per metric — no two reports disagree
Ask a question, get a report.
Type “monthly recurring revenue by plan for the last six months” and get a chart and the underlying numbers back in seconds. The AI writes the query; the figures come from your database, not its imagination — and it shows the question, the query, and the source so any chart can be checked. Drill in, change the range, and pin the answer to a dashboard.
- Natural language in — chart and figures out
- Shows its working: question, query, and source
- Pin any answer into a living dashboard tile
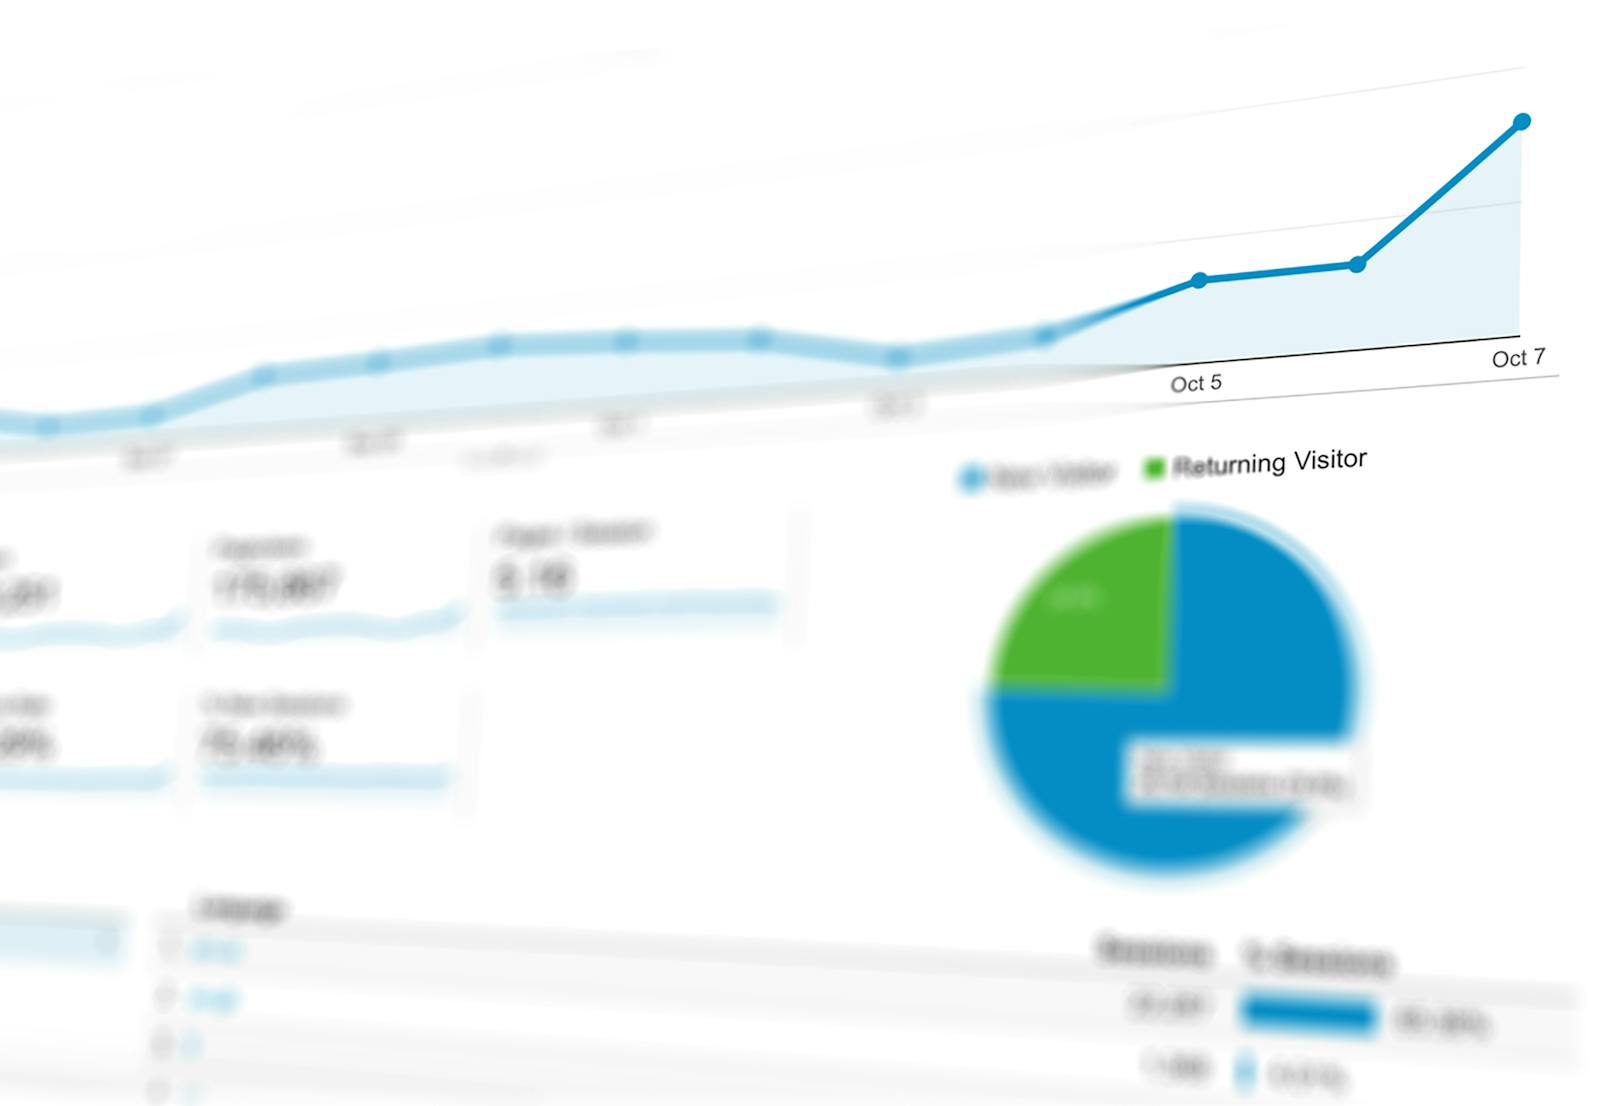
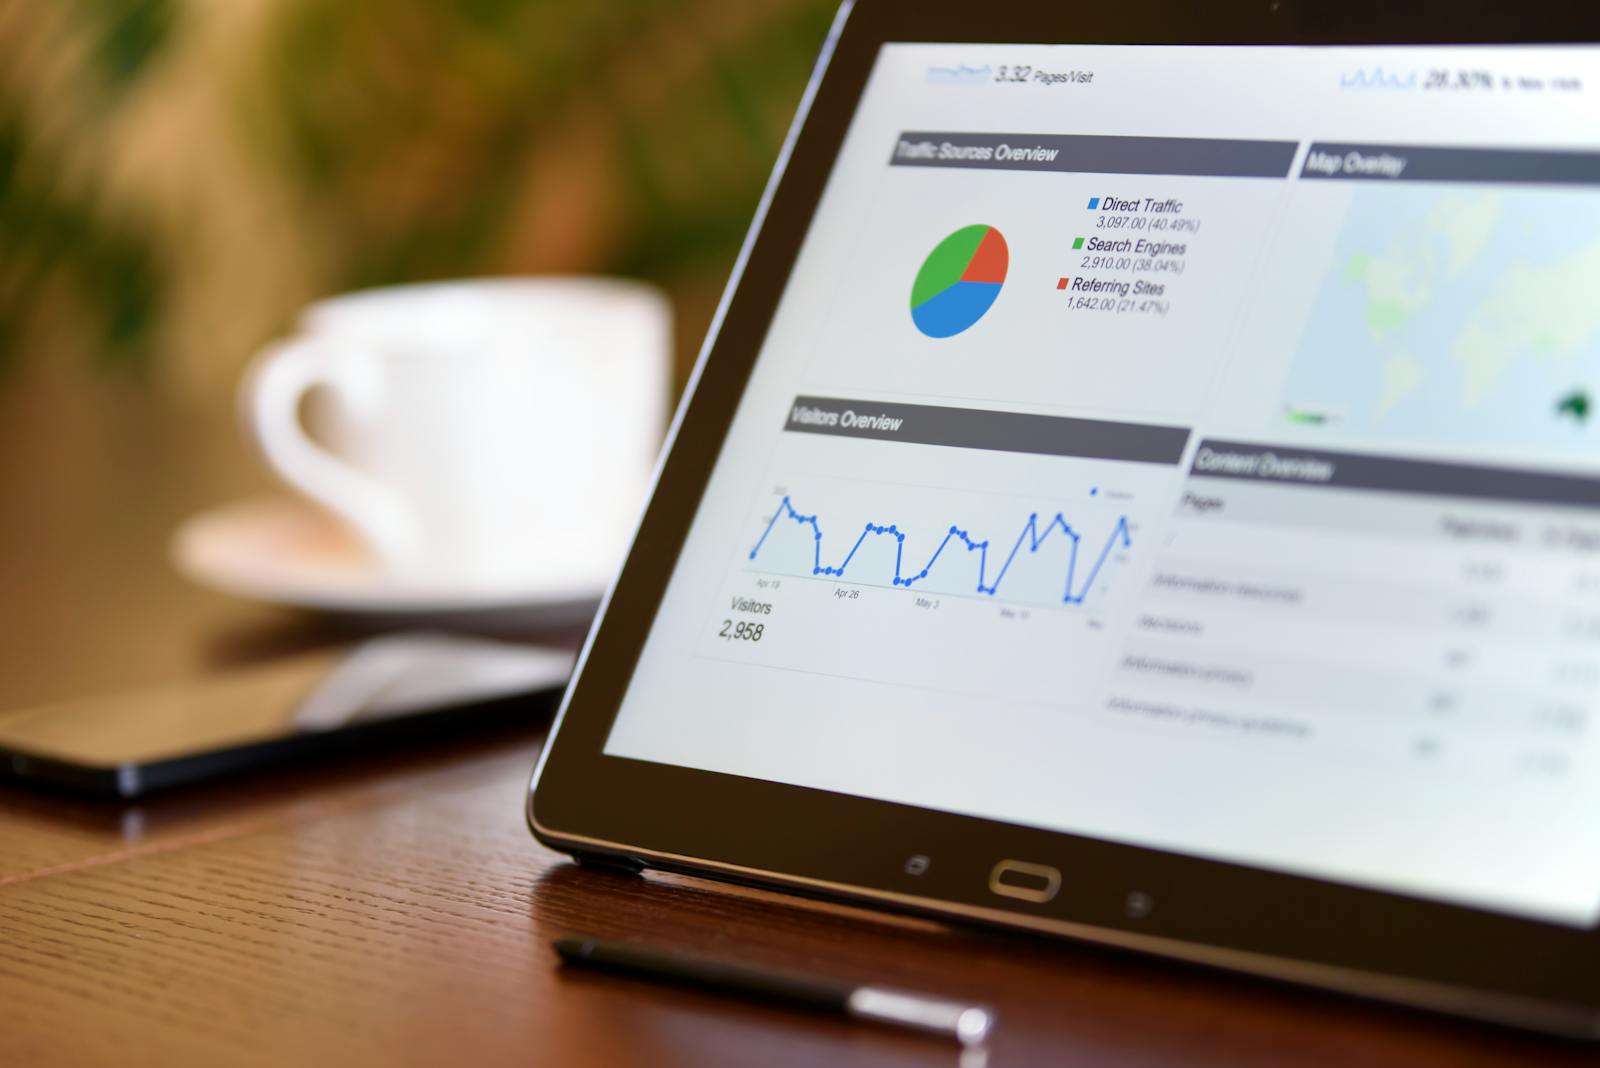
Reports that arrive on their own.
Build a report once and choose how it should show up — a PDF in an inbox every Monday, a live dashboard link, a summary in a Slack channel after month-end close. Set an alert on a metric and get pinged the moment churn crosses a line or a number moves more than it should. Nobody has to remember to run anything.
- Email, Slack, PDF, or a live link — your choice
- Daily, weekly, monthly, or on an event like close
- Threshold alerts when a metric moves unexpectedly

One source of truth, on every screen.
The whole team reading the same live numbers — not five versions of last week's spreadsheet.
Accurate, traceable, never made up.
An AI that invents numbers is worse than no report at all, so this one doesn't. Every figure traces back to a real query against your real data; shared definitions keep two reports from ever disagreeing; and a clear audit shows who changed a metric and when. The assistant drafts and explains — your data decides the number.
- Every chart traces to its source query and data
- Shared metric definitions — consistent across reports
- Audit trail for changes; ambiguity asks, never guesses
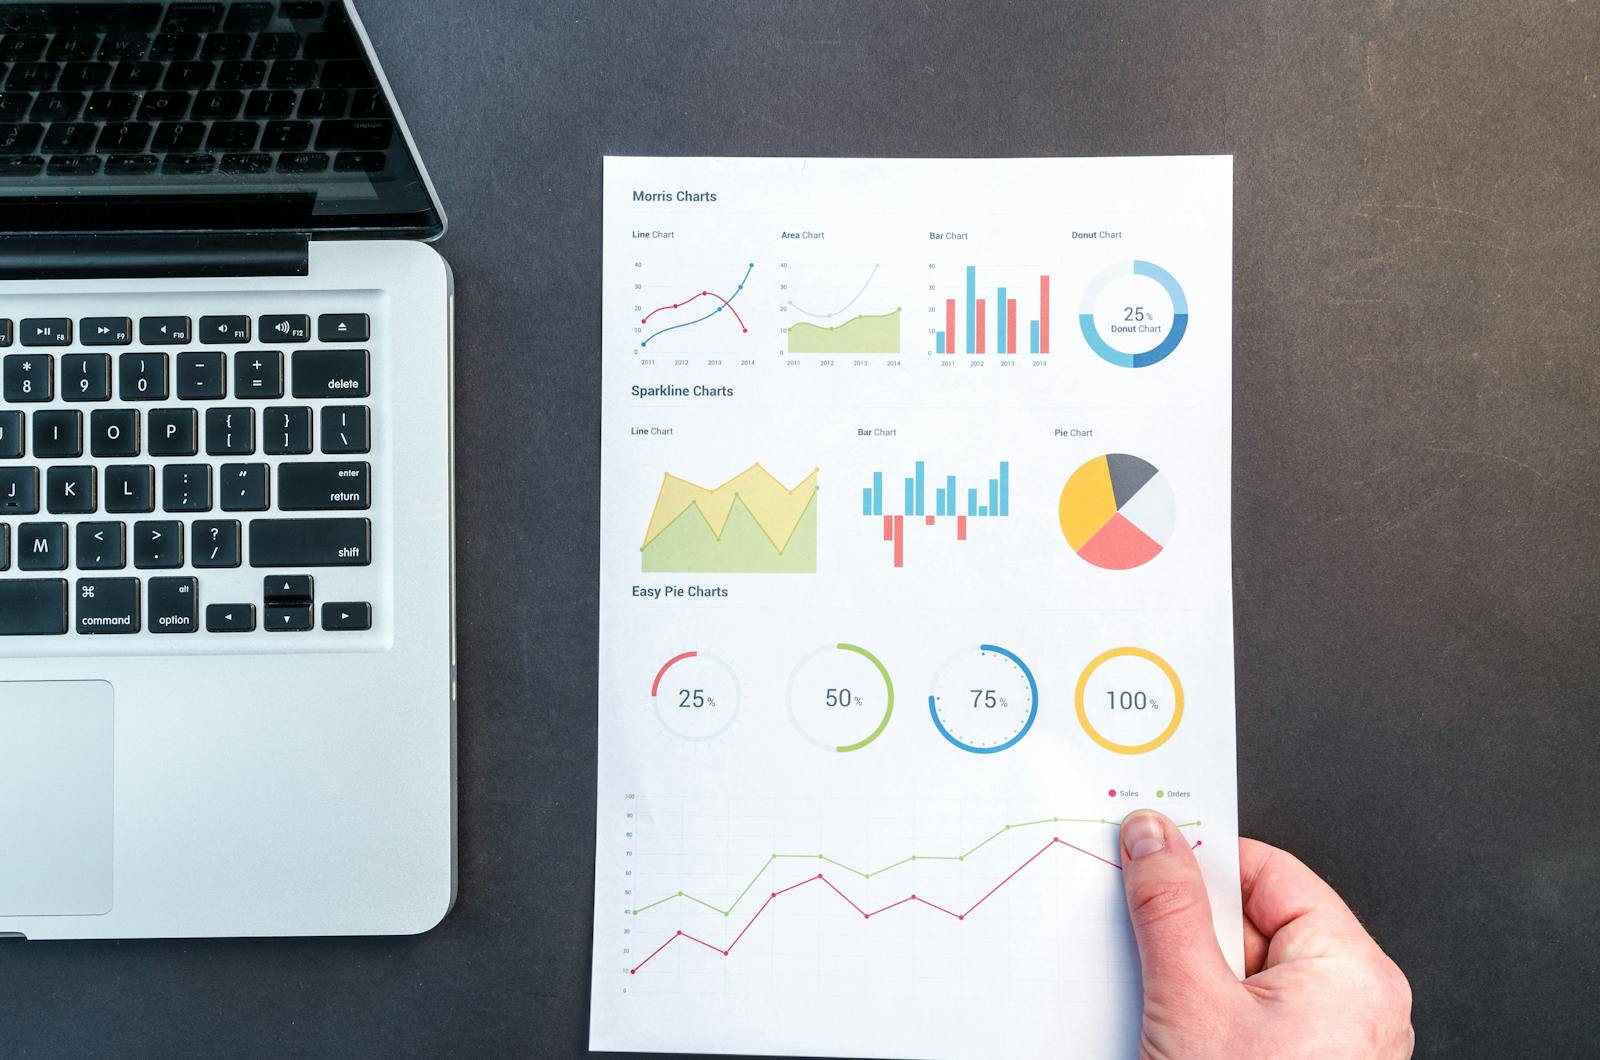
The things teams ask first.
Stop rebuilding the same report.
This Demo Lab build shows the AI-reporting pattern — connect, ask, schedule, deliver — on sample data. Tell us how reporting works for your team today, and we'll scope a system fitted to your sources, your definitions, and the reports your people actually need.